
The anatomy of an open data portal
08/11/2016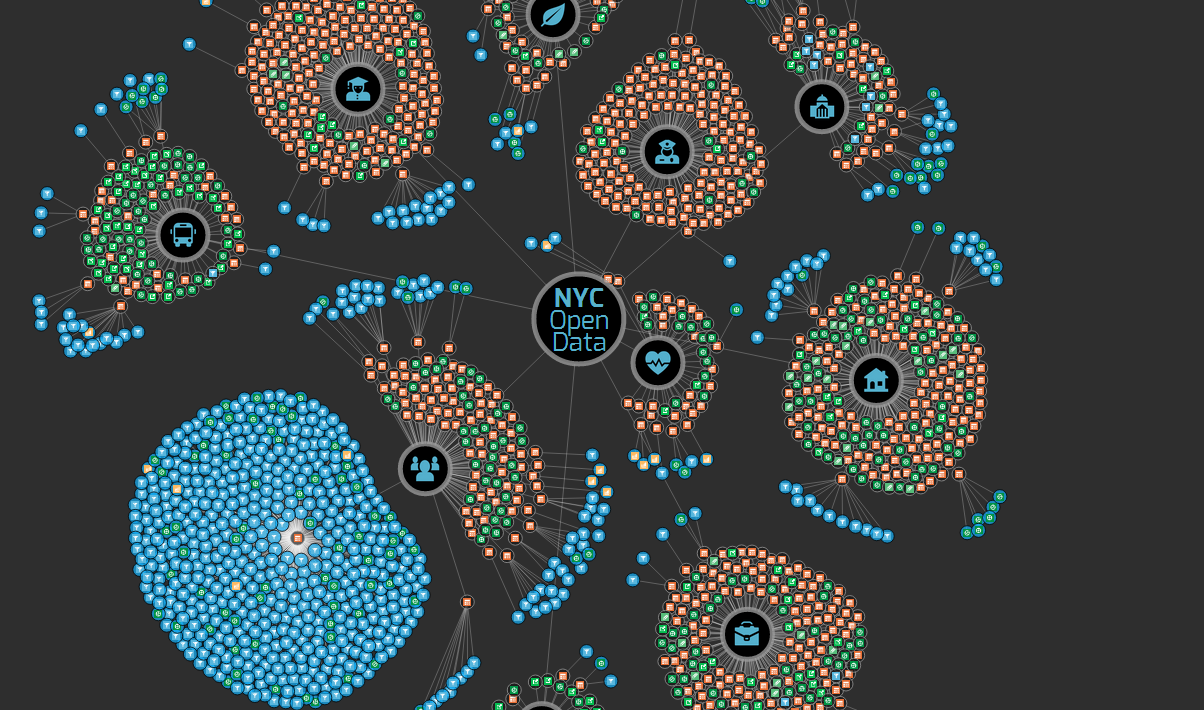
Introduction
One of the most compelling trends in technology today is the open data and open governance movement. It's not without reason that no less than Tim Berners-Lee himself, the creator of the worldwide web and one of the most preeminent scholars of the Internet, is doing his latest work in getting more government data on the web: in an interview with The New York Times a few years ago he spoke to how even records as mundane as traffic statistics or weather data could drive tinkerers to "make government run better".
New York City has been at the forefront of this movement: mayor Bloomberg (you know, the guy that founded the largest multinational information broker in the world) formalized a citywide analytics team as the Mayor's Office for Data Analytics in 2013, and the effort has continued under Mayor De Blasio, with the city cementing its first Open Data Plan in July 2015. The resultant NYC Open Data Portal was populated with over 1300 datasets when I wrote this blurb for a post five months ago—the count has jumped to 1500 now. It was, and is, the largest citywide open data portal in the world.
Nevertheless, a good open data platform is more than a count; it's a function also of all of the maintenance and structure that goes into it. So I became curious: what does 1500 mean, exactly? What's a "dataset", who's publishing them, and how well-maintained are they?
This post is about what I found.
Defining "dataset"
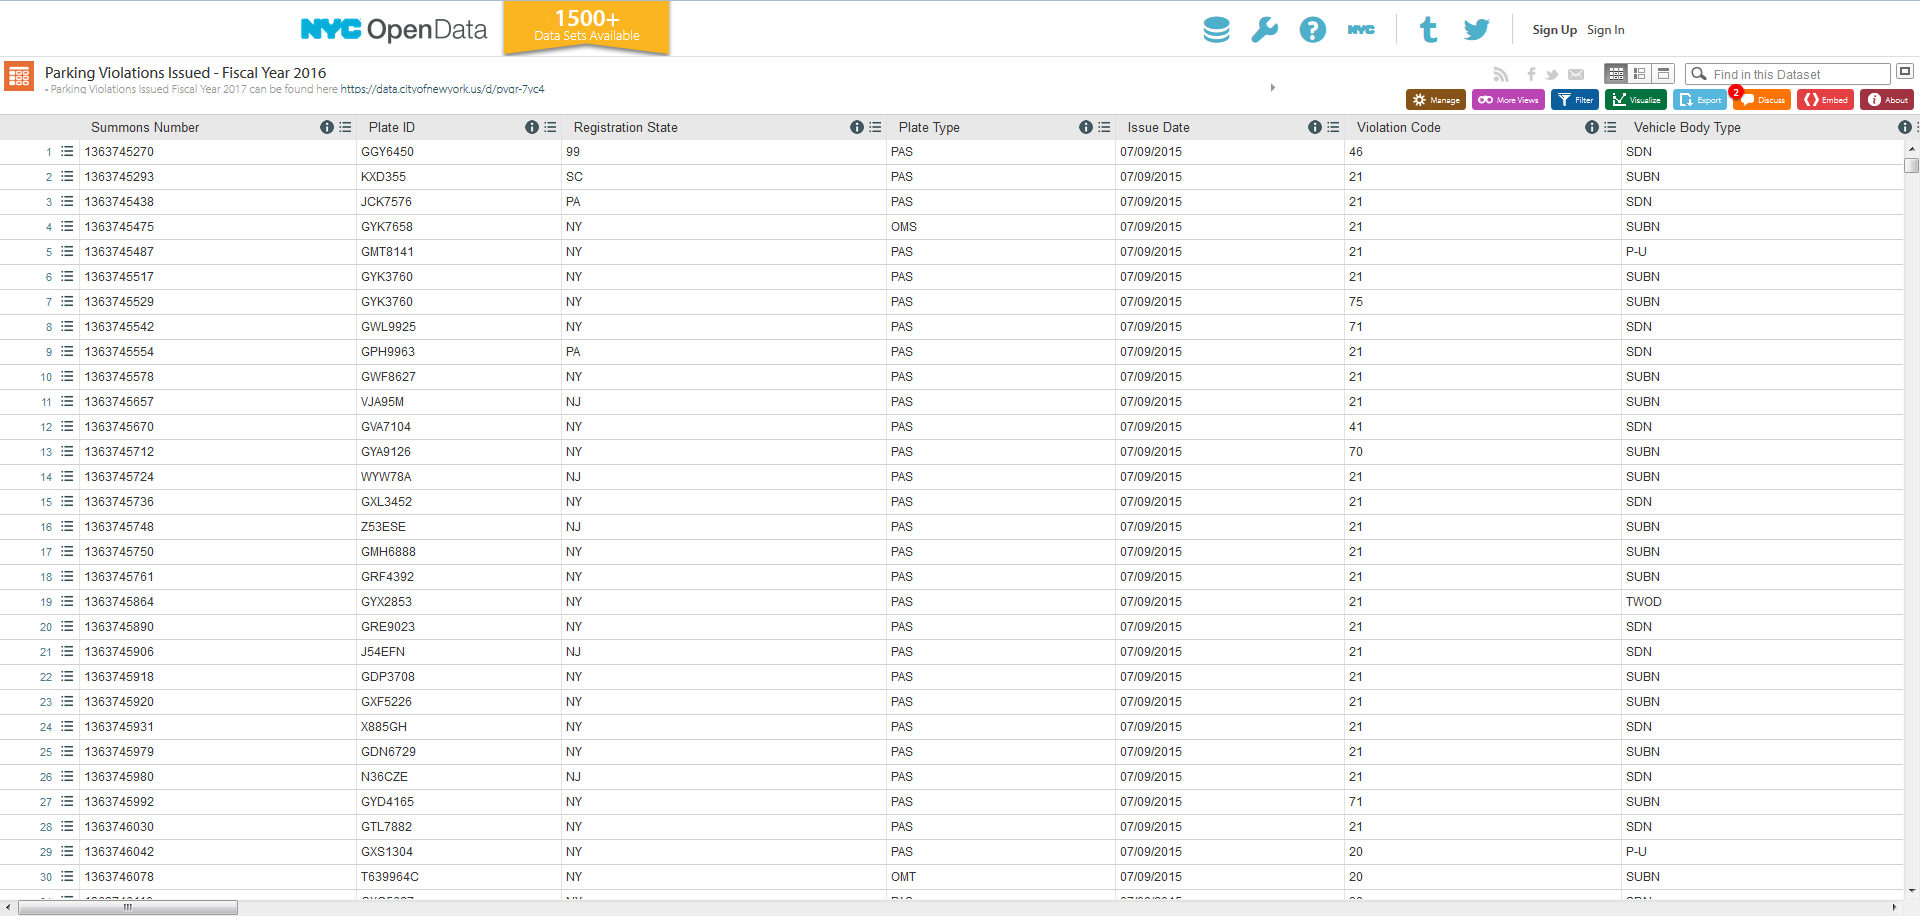
The New York City open data portal software is developed and maintained by Socrata, a late stage start-up with a dominant share of the (albeit increasingly competitive) US open data portal market. Socrata instances power the open data portal in New York City as well as ones in Chicago, San Francisco, New Orleans, Boston, Las Vegas, Dallas ...the list goes on.
Resources on a Socrata portal are organized as endpoints, each of which is given a unique URL. As of writing, there are 8145 endpoints on the New York City Open Data Portal.
But Socrata endpoints can be all sorts of things: dataset-derived charts get endpoints, for example, as do filtered versions of datasets, multipane data visualizations Socrata refers to as "data stories", private or unpublished data uploaded by individual users, and so on.
Thus studying data on an open data portal first requires nailing down a definition for the word "dataset" in the first place. Sadly there is no agreed on terminology for this, and different counts obtained in different ways will given you different results, even within the interface of the portal itself. Constructing a definition turned out to be a very non-trivial task; for the technically inclined, a Jupyter notebook I wrote on the subject is an excellent primer on the matter.
Here is the segmentation of published dataset endpoints I ultimately arrived at (all counts as of early August 2016):
- Tables — This is the familiar spreadsheet-layout data format we all know and love. We have 1073 of these.
-
Geospatial Datasets — These are geographic datasets provided in
KML,KMZ,SHP, orGeoJSONformats. There are 192 of these. - External Datasets — These are public datasets provided elsewhere on the Internet and linked to from the portal. There are 174 of these.
- Files/Blobs — These are datasets uploaded to the open data portal in a non-geospatial zipped format. There are 92 of these.
Adding these up, we find that there are 1531 datasets on the New York City open data portal—just like the banner advertises!
Characterizing New York City open data
Let's start by looking at datasets by category:
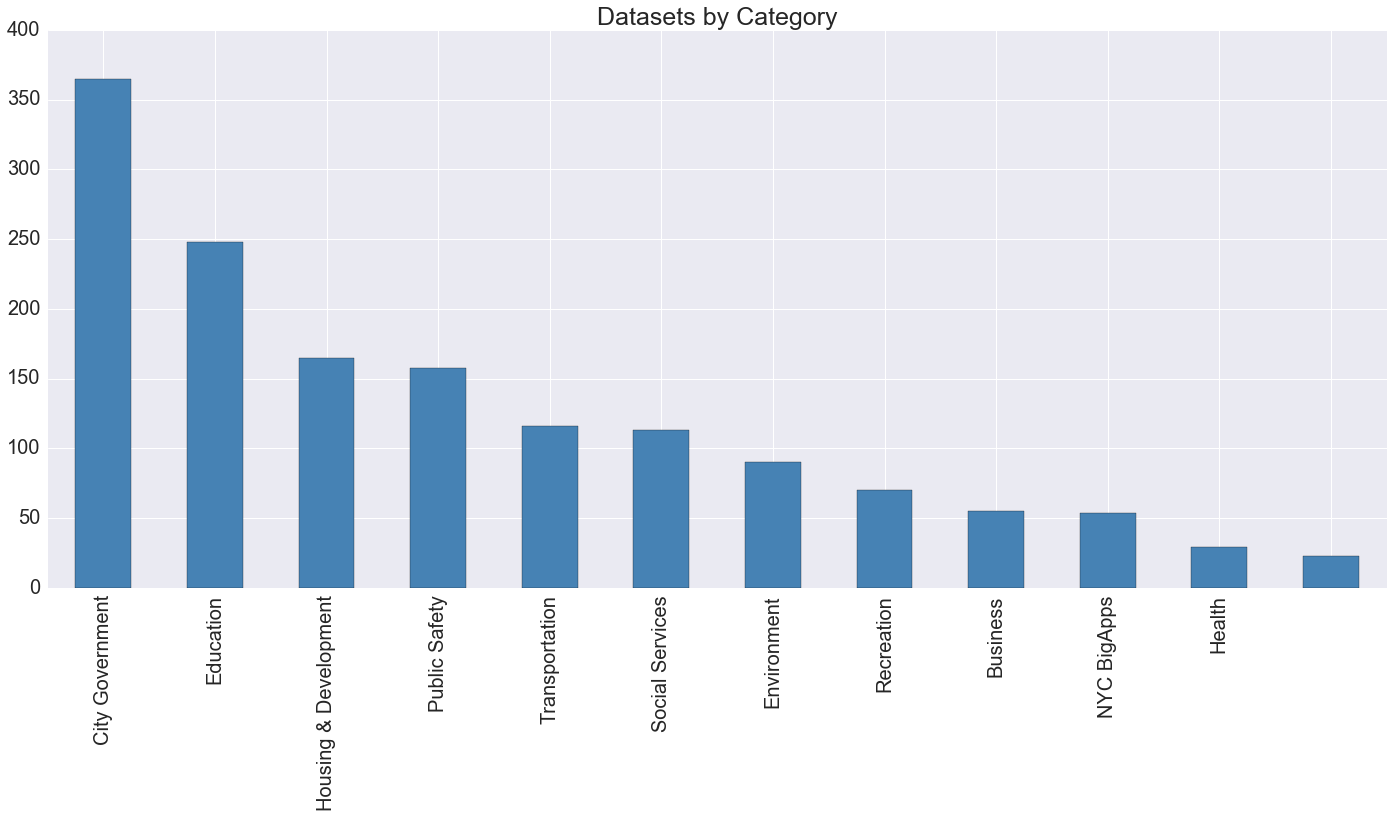
This selection isn't actually particularly informative: on an open data portal for city government, everything is...city government...so the leading label is pretty meaningless. Still, it's interesting to see that education has a strong presence on the portal.
Next up, here's dataset counts by ownership:
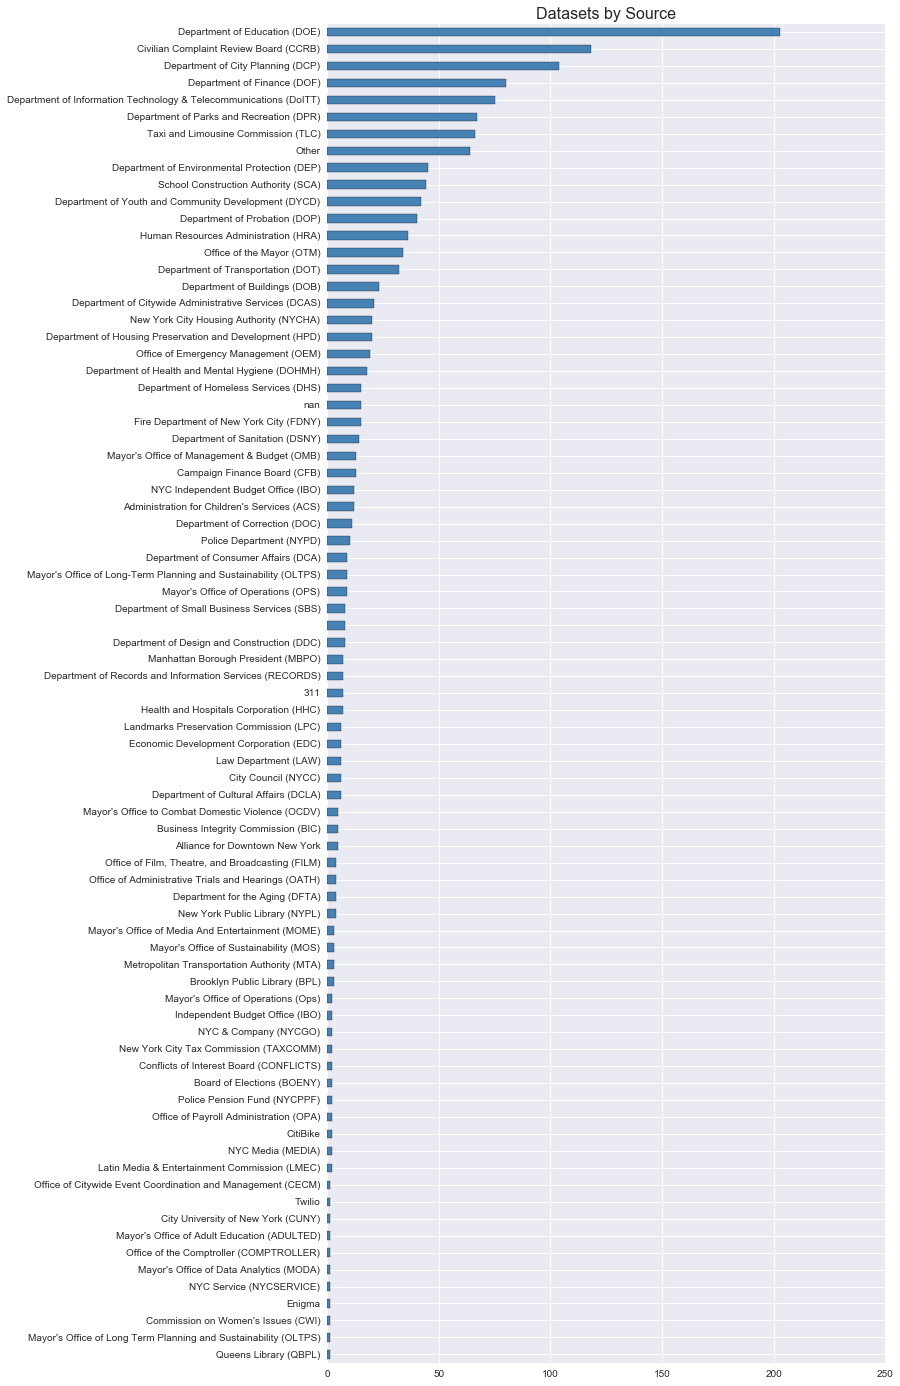
Again the DOE's education datasets put it in the lead, at least in terms of raw volume.
How frequently are datasets updated?
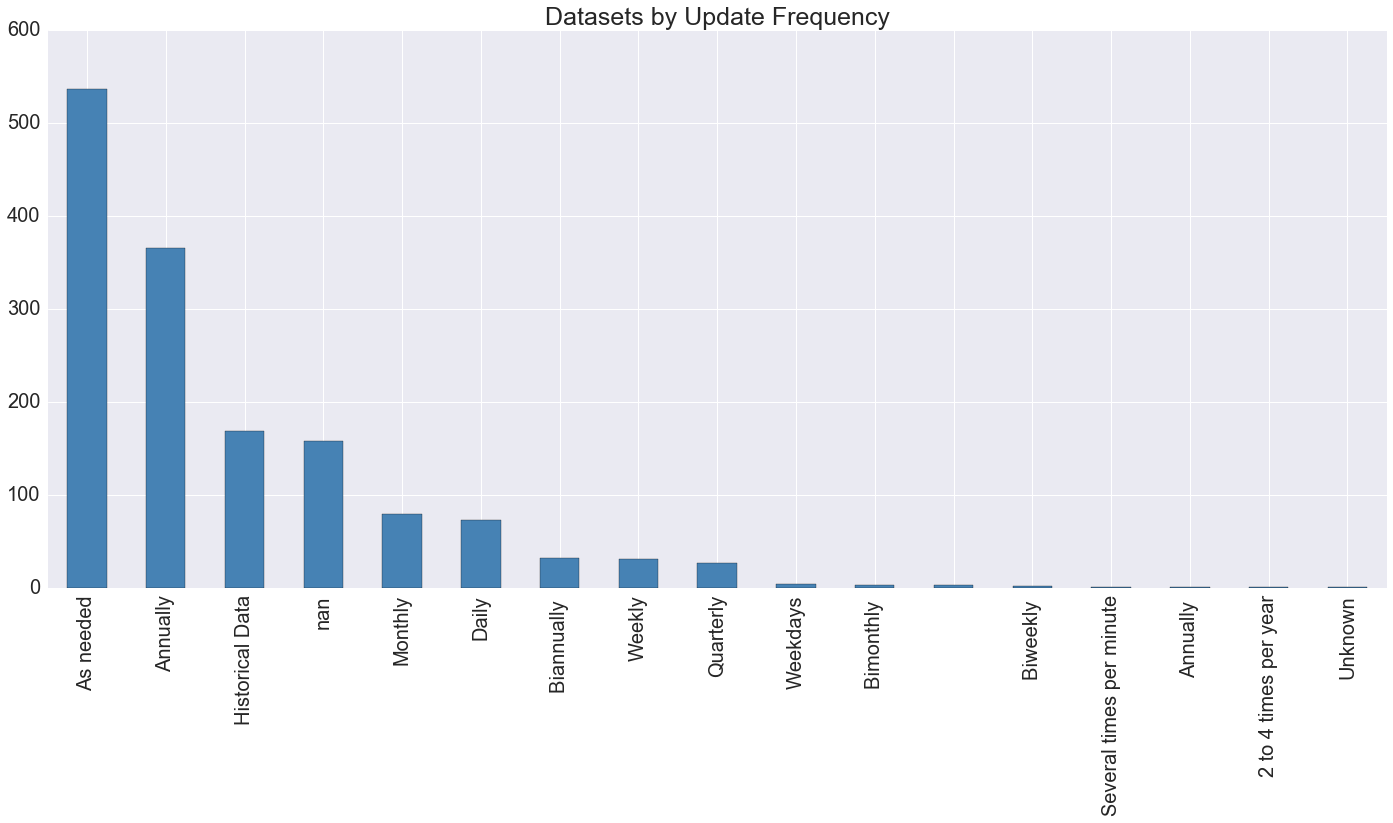
Over a third of datasets are updated "as needed" (which really could mean anything between a few months and almost never); a significant further chunk of them claim annual update frequency. The fastest turnaround time achieved by the open data portal is daily frequency—the one "dataset" claiming minutely updates is actually the programmatically-generated Socrata master catalog, which is a thing that exists but isn't really what we're interested in.
The logical next question is one of automation. While some datasets require manual administrating by the Department of Information Technology and Telecommunications, a slice of them (including, not inconsequentially, most of the more heavily utilized datasets) are updated by automatic tooling. Socrata data includes information on this...
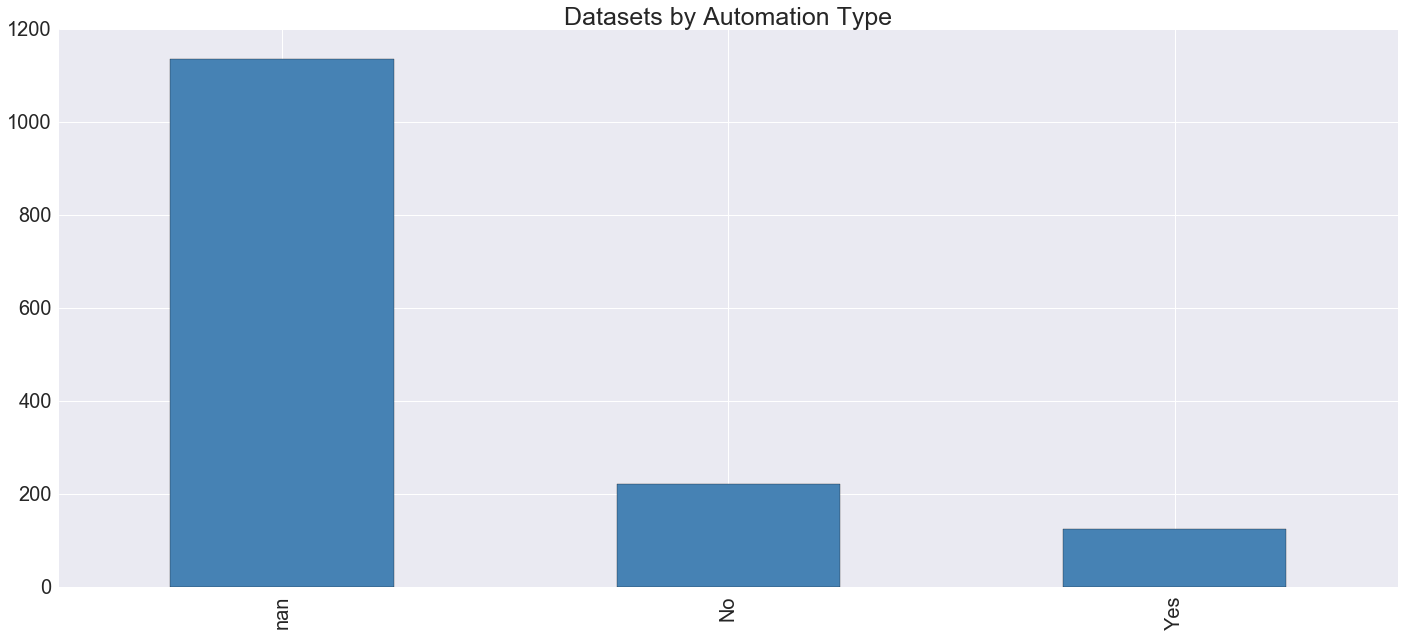
...but unfortunately it is very incomplete. Most likely "NaN" corresponds with "No", which means that, in total, there are approximately 150 automatically updated open datasets. But it's hard to know for sure, at least independently.
Next let's look at when these datasets were actually uploaded. What has the history of the growth of the open data portal been like?
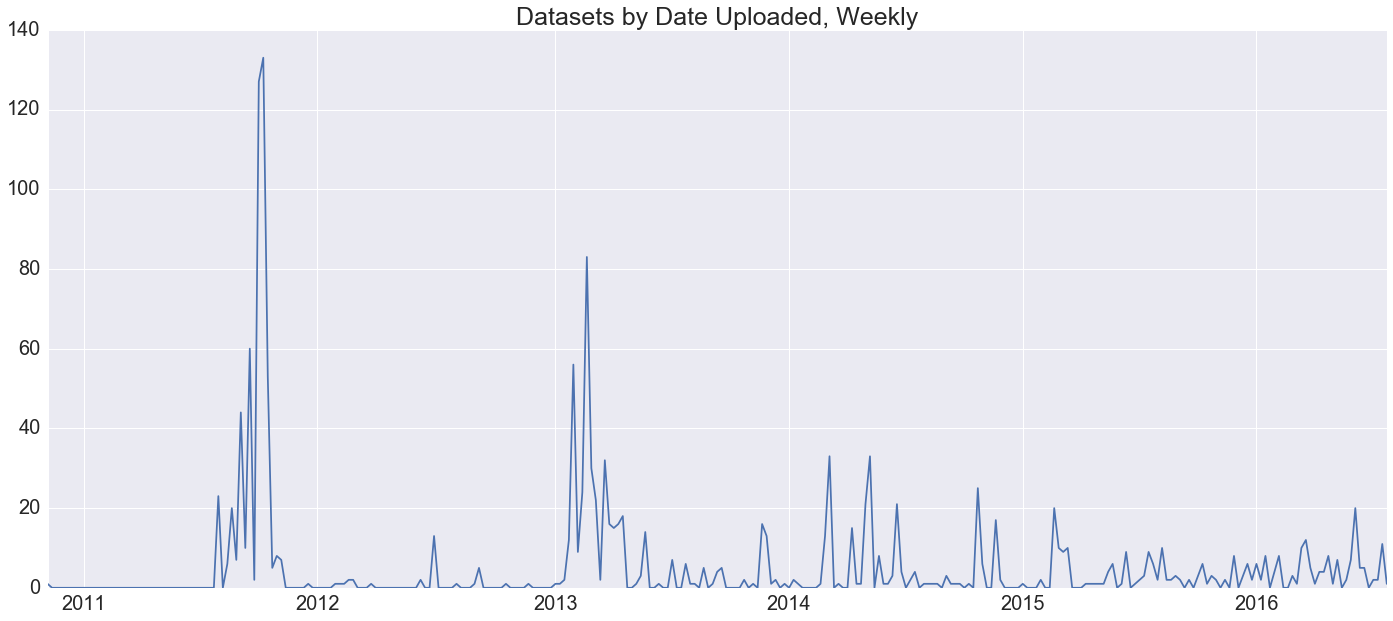
This plot shows that, in the early days, the New York City open data portal experienced really strong spikes in uploads. For whatever reason, in 2011 and 2013 the task of uploading new datasets was aggregated into sprints peaking out at specific days. The two most active upload dates of all time are 2011-09-29, which saw 65 uploads, and 2013-02-21, which saw 53 of them. As the platform matures and evolves, the folks handling these uploads have smoothed them out over the course of the year, making this hail mary a thing of the past—mostly.
I suggest that, when it comes to data timeliness, it's more meaningful to look at update recency than it is at the promises thereof in the datasets' metadata. With that in mind, here is a cumulative plot of the data update recency of all of the datasets on the open data portal, going back two years to August 2014:
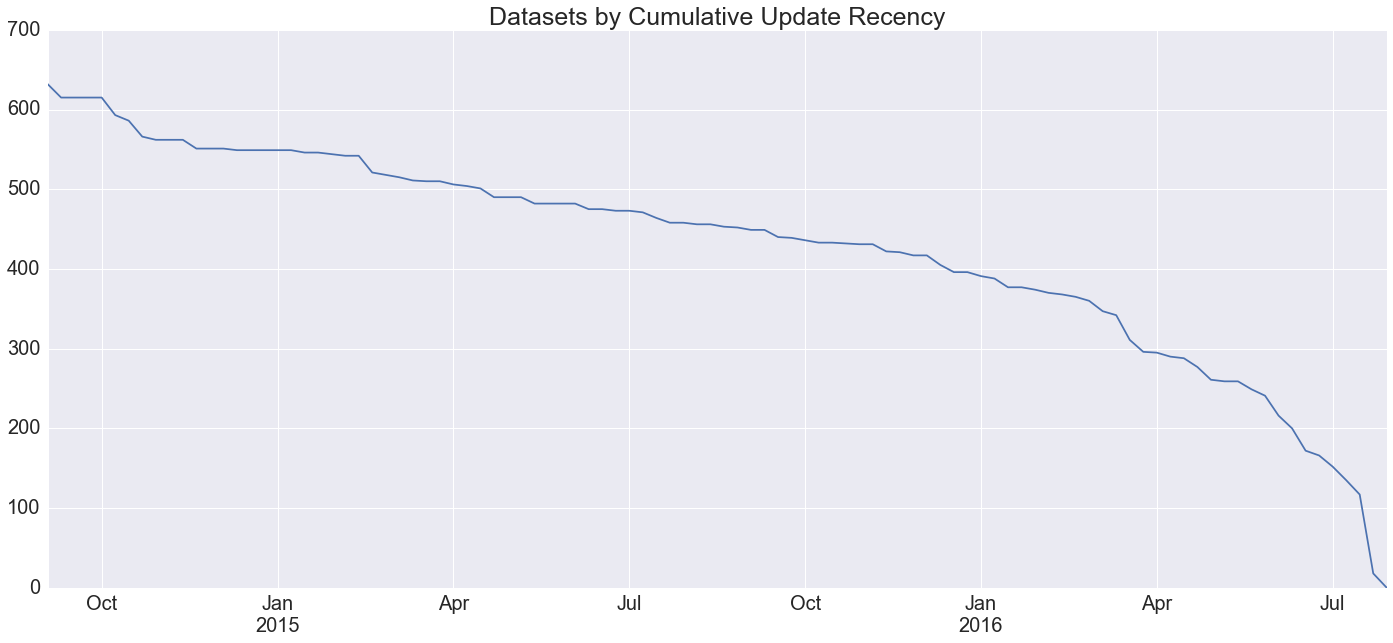
About 100 datasets have been updated in the last two months (~7% of the ~1500 total), about 400 in the last six
months (~25%), about 450 within the last year (~30%), and about 650 within the last two years (~45%).
Unfortunately it's not possible to go any further back because a software update at that time seems to have
touched the updatedAt parameter of every dataset on the portal.
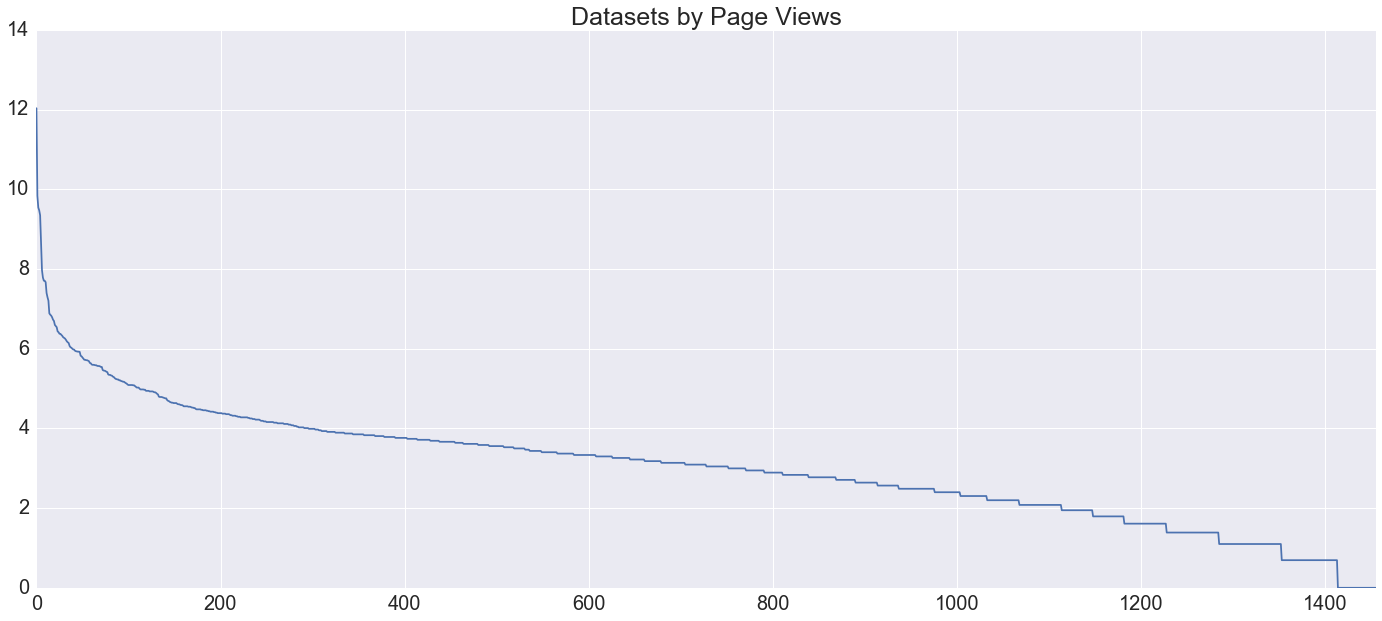
One last parameter I looked at was dataset popularity. Not unexpectedly (per Zipf's law) this turned out to follow a logarithmic
distribution. For instance, the top ten datasets on the open data portal had [167921,
18697, 13908, 12959, 11463, 5866, 3038, 2897, 2497, 2406] views, necessitating that the following plot
squeeze on a logarithmic axis, where each tick represents a tenfold increase in view-count:
You know what? Socrata does this one better.
Running your own analysis
The techniques I used to get the data I used for this study are mostly transparent and totally transferable to any Socrata portal of interest.
Socrata portals provide metadata about their data in two different formats: the Socrata Catalog API, which provides rich metadata on
every endpoint on a portal, and the
data.json endpoint, which provides only endpoints fitting our definition of a "dataset", but has less
information on them. Thus to get the most out of portal metadata we have to match the endpoints returned by data.json to the ones returned by the catalog API.
I've made the resources I've used for this project—including the code handling that match—available on
my socrata-portal-metadata
repository on GitHub. If you want to replicate this study for your own home portal, that is where you should go!
Want to see more longitudinal data on open data portals nationwide? Then Thomas Levine's "Analyzing all the datasets" has got you covered.